Your CDN cache hit ratio is lying to you
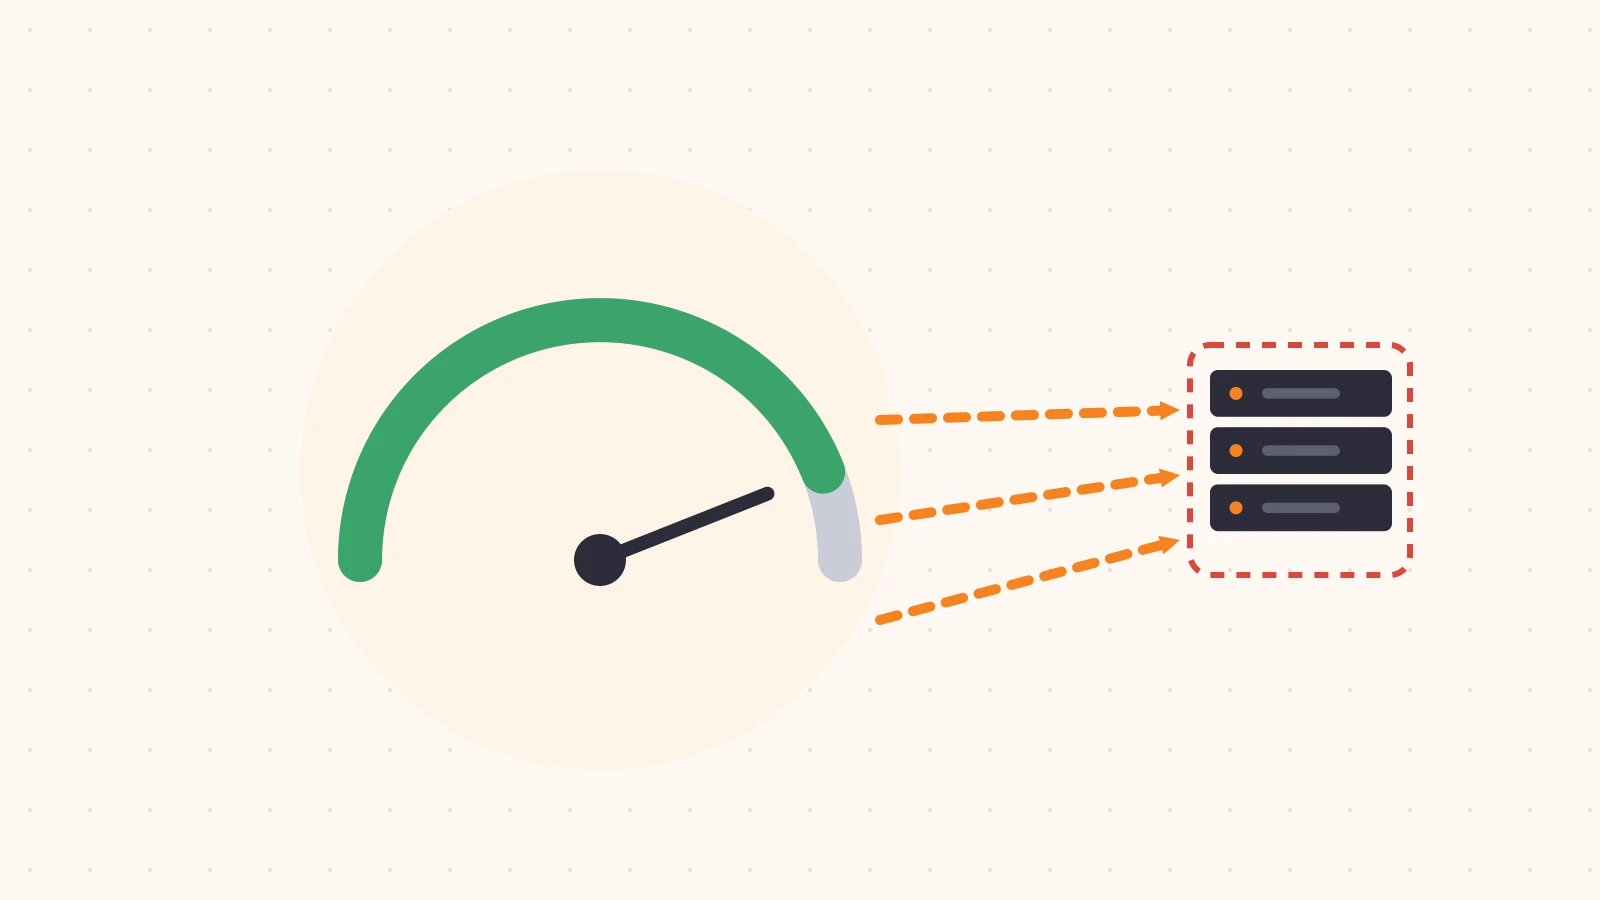
The cache hit ratio is usually the first number anyone looks at on a CDN dashboard. It’s a single percentage, it’s easy to put in a slide, and when it’s high everyone relaxes. If 90% of requests are served from cache, the origin must be doing fine.
Except the ratio often isn’t measuring what we think it is. A high hit ratio can coexist with an origin that is busier than it should be, a bandwidth bill that keeps growing, and pages that are slow for real users. In this post we’ll look at why the headline number can be misleading, the three settings that most often distort it, and how to measure what actually matters: how much work your origin is still doing.
What the ratio counts (and what it leaves out)
Most dashboards calculate the hit ratio by request count: cached requests divided by total requests. That sounds reasonable until you think about what those requests are.
A typical page pulls in dozens of small static assets: icons, fonts, CSS, small images. These are easy to cache and are almost always hits. The HTML document, API calls, and large media files are fewer in number, but they’re where the real cost and latency live, and they’re the ones most likely to miss.
So a site can report a 92% hit ratio by request while most of its bytes, and most of the expensive requests, still go to the origin. Three questions help cut through it:
- Is this ratio by requests or by bytes? If your dashboard offers both, look at bytes. That’s closer to what drives egress cost and origin load.
- What does it count as a hit? Some views count revalidated responses or stale responses differently. Know which definition you’re reading.
- What’s excluded? Requests that are never eligible for caching (for example, because of a bypass rule) are sometimes left out of the ratio entirely. That makes the number look better, not worse.
The three settings that usually cause it
When the origin is busier than the hit ratio suggests, the cause is usually one of three things.
1. Cookies that make everything uncacheable
Many caches won’t store, or will bypass, responses when a request carries cookies or when the response sets one. That’s a safe default, because cookies often mean personalized content. But on most sites, analytics, A/B testing, and consent tools set cookies on every visitor, including on pages that are identical for everyone.
The result: anonymous traffic to static pages behaves like logged-in traffic and goes to the origin every time. Check for:
- Responses with
Set-Cookieon pages that don’t need it. - Cache rules that bypass on the presence of any cookie rather than specific session cookies.
2. Query strings that fragment the cache
By default, many caches treat the full URL, including the query string, as part of the cache key. That means these are three different objects:
/pricing
/pricing?utm_source=newsletter
/pricing?utm_source=newsletter&fbclid=abc123
Marketing parameters, click identifiers, and cache-busting timestamps can turn one cacheable page into thousands of variants, each of which has to be fetched from the origin at least once.
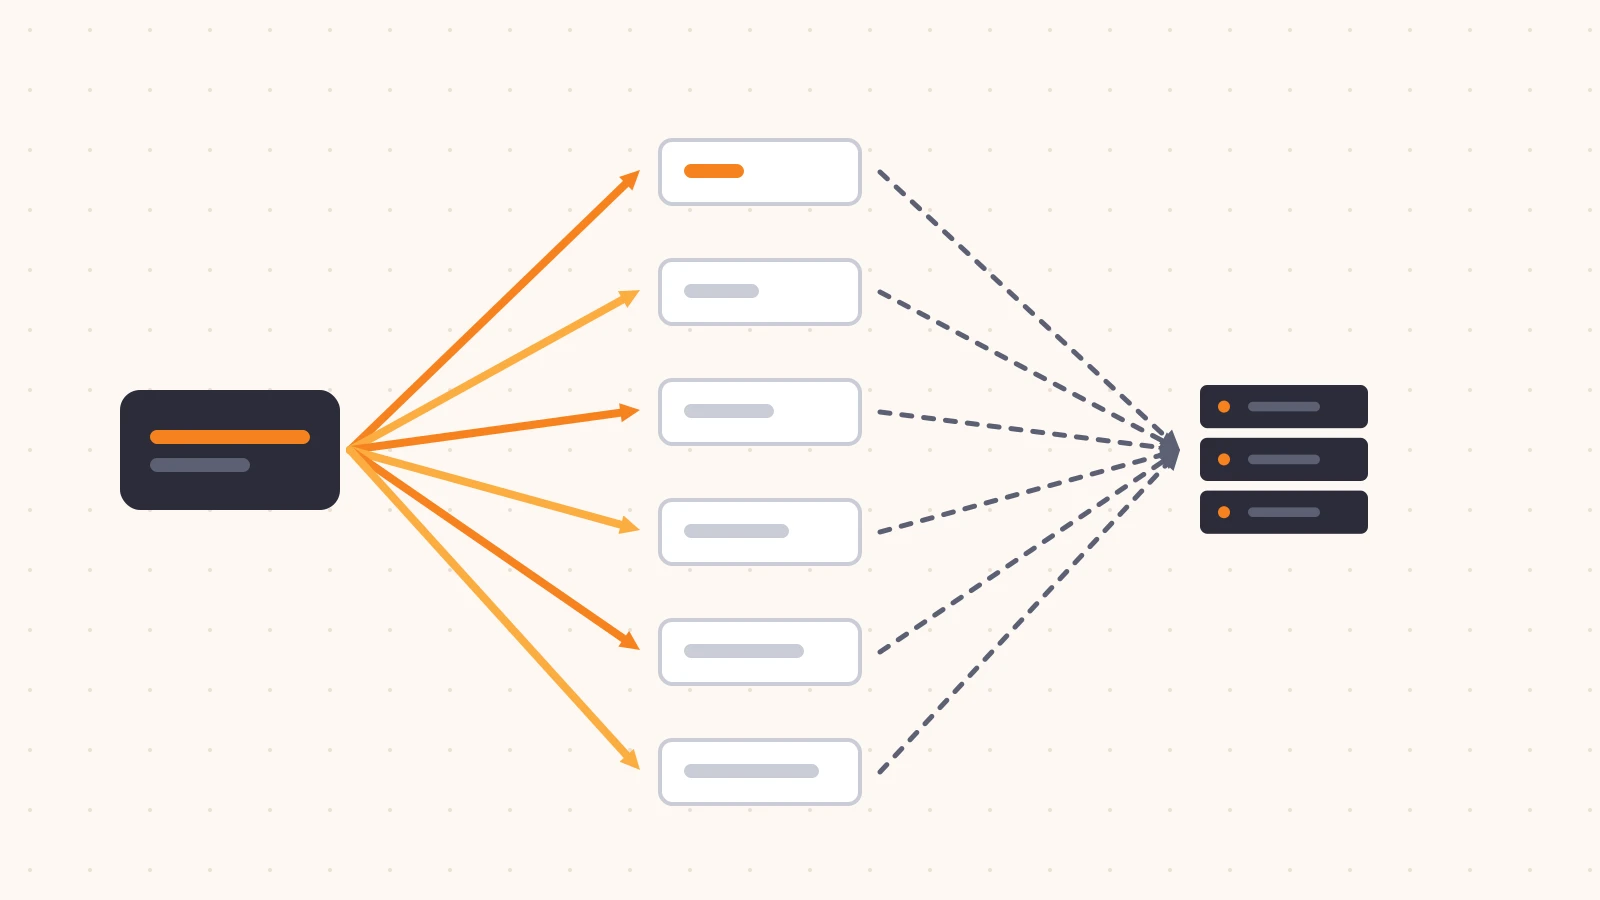
Each of those variants is a separate miss before it becomes a hit, and many of them are requested exactly once. They barely move the ratio, but they all land on your origin. The fix is to decide which query parameters actually change the response, and leave the rest out of the cache key.
3. Cache headers that say “don’t”
Your origin tells the cache what it’s allowed to do through response headers. It’s easy for a framework default or a single line in a web server config to tell the cache not to store something that is perfectly cacheable:
Cache-Control: private, no-cache, no-store, max-age=0Common causes include frameworks that send no-store on every response by default, a Vary header on a value that changes per request, and very short max-age values on assets that change once per deploy. If your cache respects origin headers, which is usually the right default, the origin is in charge, and it may be telling the cache to step aside.
How to check yours
You can get a realistic picture in an afternoon.
Look at bytes, not just requests. If your dashboard shows bandwidth served from cache versus from origin, start there. Compare it to the request-based ratio. A big gap is a signal.
Sort misses by URL path. Find the paths that generate the most origin requests or the most origin bytes. In most cases a small number of paths account for most of the misses.
Inspect real responses. For the top missing paths, look at what the origin sends back:
curl -sI "https://www.example.com/pricing?utm_source=test" \
  | grep -iE "cache-control|set-cookie|vary|age|expires"
Then look for the response header your CDN uses to report cache status (often something like x-cache or a *-cache-status header) and request the same URL twice. If the second request is still a miss, something is preventing it from being stored.
Check your origin’s own logs. This is the ground truth. Count requests at the origin that came through the CDN, grouped by path. If static pages and assets show up there often, they aren’t being cached the way you think.
What to change
Once you know where the misses come from, the fixes are usually small:
- Normalize the cache key. Ignore or strip query parameters that don’t change the content, such as tracking parameters and click IDs. Keep only the ones that matter.
- Be specific about cookies. Bypass cache on your actual session or authentication cookie, not on the presence of any cookie. Stop setting cookies on responses that don’t need them.
- Fix headers at the source. Set explicit
Cache-Controlvalues for static assets, ideally with long lifetimes and versioned file names. Review framework defaults that disable caching globally. - Track origin load as a metric. Alongside the hit ratio, track origin requests per second and origin bytes. Those are the numbers that map to cost and capacity.
Closing thoughts
The cache hit ratio isn’t wrong, it’s just incomplete. It answers “how many requests were served from cache,” when the question you usually care about is “how much work is my origin still doing, and why.” Looking at bytes, misses by path, and real response headers will tell you far more than the headline percentage.
At Plimie we’re building read-only reviews that look at whether the edge features you pay for, caching included, are actually delivering. Our pilot is free and invite-only. If you’d like us to take a look, request a free review.